

Hi all, I am writing this post after a long time due to moving to a different country and trying to get my head around everything new. This post is about the trending #INFOGRAPHICS in academia. We are surrounded by pictures, videos, reels, posters, flyers, graphs so on and so forth in our everyday life. Be it an advert for the morning coffee, Instagram posts from friends, or data visualization on any professional platform. Almost everything around us is now presented in a visual format that is appealing, interesting, and engaging. Therefore, the researchers are also trying to keep up with this trend of visual information and presenting research in an interesting visual method. There has been an upsurge in the use of infographics for research papers and scientific presentations.
Some of the advantages of using infographics are
- Visually appealing – we all like it, we are enticed by it
- Simplifies complicated information
- Reaching out to right people – It helps us disseminate our work to right people who are stakeholders or decision makers
- More views – more downloads – more citations
So, we all know its benefits and find it fascinating but most of us are unsure of how to create such a visually appealing presentation because not all of us are creative graphic designers.
I was inspired by the stunning infographics that other researchers had been posting on twitter, so I started researching about infographics and trying to find techniques to present my research work in a more interesting way. I came across CANVA website which is free and good for personal use. Free Design Tool: Presentations, Video, Social Media | Canva
It has a plethora of options for designing and presenting your work including templates for resume, business report, marketing proposals, timeline report, videos, teaching and education presentations, adverts, flyers and many more. You can use an existing template or customise it for your need. You can also share it with your team members and work on group projects. It has many features worth exploring.
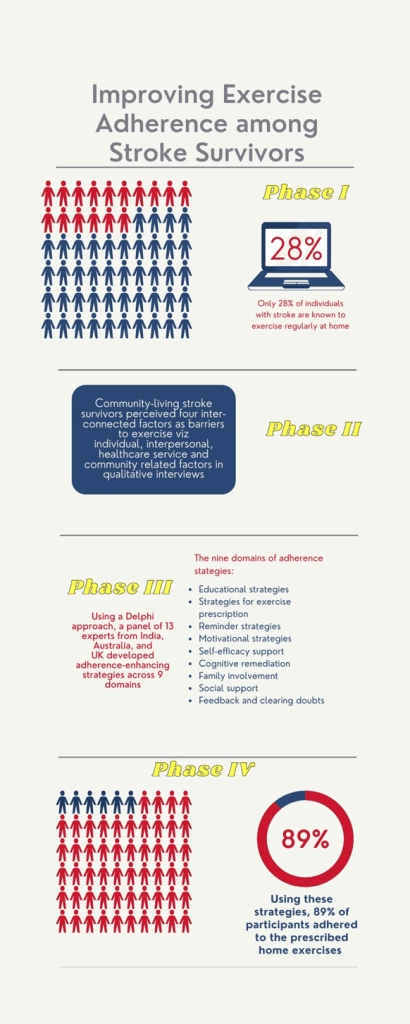
I have used Canva for preparing a summary of my PhD research, which is not the best infographics you would come across, but it was easy to prepare and provided basic information about my research.
Some other software on infographics that might interest you are:
-Piktochart
-Infogram
-Snappa
-Freepik
Find out more information on these software in this post – https://piktochart.com/blog/best-infographic-makers/
Hope you enjoyed reading this post and excited to make your own infographics!
Cheers,
Amreen

One thought on “It’s all about being VISUAL – Infographic tools”